Draft Strategies | Depth Charts | Mock Drafts | SOS | Tools | ADP
Diehards Staff Experts Poll | Draft Simulator | University Videos
DFS Cash Game Quarterback Breakdown and Analysis

DFS Cash Game:
Quarterback Breakdown and Analysis
In 2020, Fantasy Football Diehards must be prepared for any and all news in order to navigate and finish in the black for DFS cash games. In order to construct winning lineups, Sunday mornings will be spent scrutinizing the inactive and Reserve/COVID-19 lists more than ever before. Luckily, nothing new for me…I have been observing pregame shows since 1978.
Attending high school in the Eighties, I revered quarterbacks, studied the best in the business and read as many biographies as possible. I relish my Sunday memories watching football with my Dad and arguing on the phone, and in school, with my friends about who was the preeminent quarterback in the NFL.
When the NFL changed illegal contact to free up receivers by restricting touching/holding beyond five years downfield in 1978, the game changed dramatically. The new rules unleashed the modern passing game, and Steelers’ QB Terry Bradshaw took advantage of the changes with a dynamic-duo at wide receiver: Lynn Swann and John Stallworth. The future Hall of Famer tossed a career-high 28 touchdowns to lead the league on 208 completions for less than 3,000 yards. The numbers seem pedestrian by today’s pass-happy standards but were so notable as a 12-year old.
By 1980, the Chargers’ Air Coryell aerial assualt subjugated secondaries across the league. In 1979, QB Dan Fouts established an NFL record for passing yards with 4,082, surpassing Joe Namath’s mark of 4,007 in 1967. Over the next two years, the Chargers’ triggerman passed for 63 touchdowns and 9,517 yards. My Dad and I loved when San Diego would make a national television appearance at the 4 PM ET timeslot. During the late game on the East Coast, we always ate dinner together in the living room, and Air Coryell awed us with Fouts, WR John Jefferson, WR Charlie Joyner and TE Kellen Winslow.
Scholar’s Most Owned DFS Quarterbacks
Player, team (starts): Average Points, PV Ratio
- Patrick Mahomes, Chiefs (7): 27.5, 3.87
- Deshawn Watson, Texans (7): 26.5, 4.07
- Russell Wilson, Seahawks (7): 25.9, 3.82
- Ben Roethlisberger, Steelers (7): 19.4, 2.91
- Cam Newton, Panthers (6): 23.6, 3.70
- Matt Ryan, Falcons (6): 22.2, 3.55
As a freshman in college, I will never forget Dan Marino’s sophomore season in 1984. Entering the campaign, the New York Giants’ Y.A. Title (1963) and the Houston Oilers’ George Blanda (1961) shared the single-season passing touchdowns record with 36. The Dolphins’ sensational signal caller earned the league’s MVP, throwing for 48 touchdowns and over 5,000 yards: Both are now held by Peyton Manning after his enchanted 2013 crusade.
As a history teacher, I often reflect on the past and daydream about making DFS lineups from my youth. Who would anchor my DFS lineups in the mid-Eighties? Would Marino be worth over 20% of my salary cap? Or would I pay down for a signal caller like Ken O’Brien, Jets or Neil Lomax, Cardinals? Unfortunately, I cannot use the Speed Force to go back in time. I must look to the future and hope to gain insight by looking into past lineup decisions.
I only play in 50-50 contests every week and one of my key decisions is selecting a quarterback. After acquiring a tight end, my next choice focuses on the quarterback position. Before beginning the research, my hypothesis stated that living in the middle-class salary range provides the best bang for the buck. However, is it an accurate deduction? What does the data illustrate?
In an effort to be completely transparent, I have posted a link in Google Sheets of the raw data from all of my weekly lineups.
Click the link: https://docs.google.com/spreadsheets/d/1vmtOcHnamCqNitTT4PUgFCbwYoNCHRm_GyHDCCgFoYk/edit?usp=sharing
Scoring Breakdown: High-Median-Low
:strip_exif(true):strip_icc(true):no_upscale(true):quality(65)/arc-anglerfish-arc2-prod-gmg.s3.amazonaws.com/public/MCSEIBTGSBF4ZBB5EXFL3CT25I.jpg)
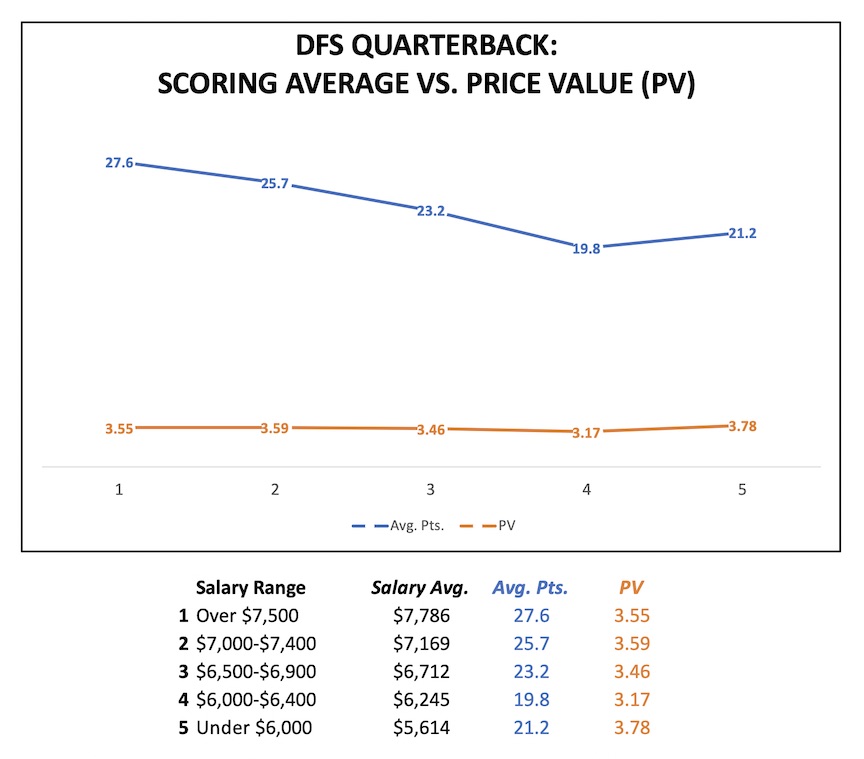
I immediately wanted to look at the results for paying up ($7,000-$8,000) at the position. Over three years, I invested in the upper-echelon of quarterbacks on 20 occasions. There is no doubt that the investments paid a healthy dividend: The selections averaged 25.7 points and returned a spectacular 3.59 PV ratio. Patrick Mahomes was my most owned player (5) in the price range, surpassing my targeted PV ratio of 3.0 while averaging 21.9 points.
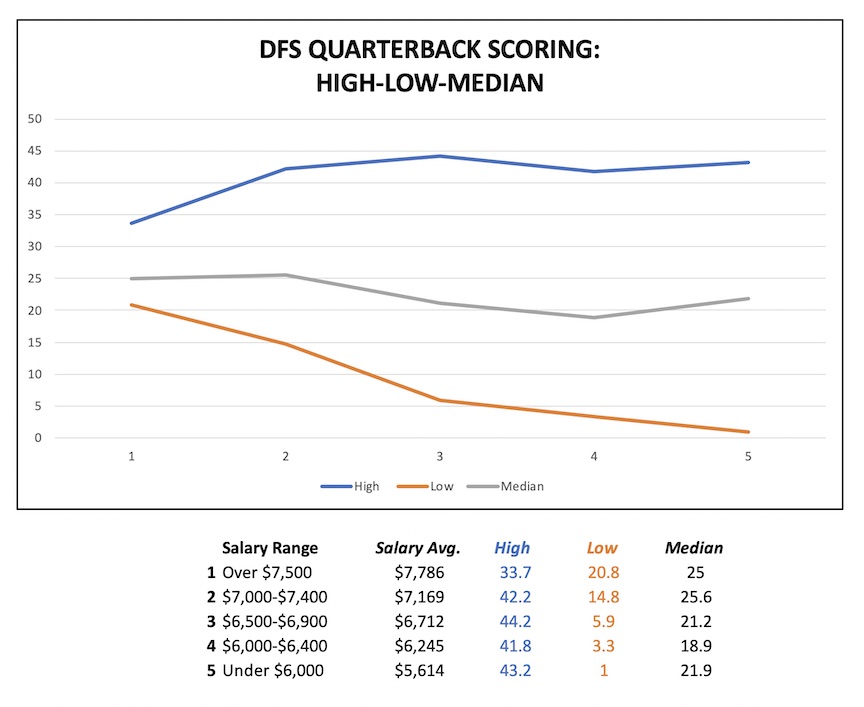
The middle class ($6,000-$6,900) provided the most attractive price range to invest. In 47 lineups, I choose a quarterback in the aforementioned category and averaged 21.6 points with a 3.33 PV ratio. There is more variance and risk in this category, scoring over 30 points 10 times (21%) and less than 10 points in five contests (10%). In comparison, the upper-echelon quarterbacks fell below 20 points only three weeks (15%). By far, Deshawn Watson hooked me up more than any signal caller: In five games, he averaged 24.7 point and produced a 3.68 PV ratio.
Scholar’s Tips for Targeting Quarterbacks in DFS Lineups
1. Opponent Rankings versus Quarterbacks: Bottom 10 Defensive Units
2. Vegas Odds: Over/Under 46 points
3. Home Underdog: Advantageous 4th Quarter Game Script
4. Pass Attempts and Completions over the past three games
5. Salary Cost vs. Personal Rankings
Looking at the results, I am satisfyingly shocked at the return on investment among the basement dwellers. I identified 35 starters under $6,000 and am more than happy with the results: My picks averaged 21.2 points and achieved a 3.78 PV ratio.
Scholar’s DFS Bargain Basement Megastars
- Ryan Tannehill, Titans: 31.5 (2019)
- Andy Dalton, Bengals: 28.9 points (2018)
- Case Keenum, Broncos: 25.1 points (2018)
- Kyle Allen, Panthers: 25.2 points (2019)
In order to be comfortable in the lower price range, DFS players must embrace risk and variance. On a positive note, my selections surpassed 30 points five times but scored less than 10 points in three lineups. Jameis Winston produced Pro Bowl numbers in this price range: In four games, he averaged 25.4 points and far exceeded my expectations with a 4.29 PV ratio…Wow!
Quarterback DFS Conclusion
Analyzing the numbers, it is apparent that a DFS player can succeed in any price range at the quarterback position. It depends on the risk level a player is willing to embrace. I am not worried about the salary as much as looking at the matchup using my Tips for Targeting QBs that I posted above. However, I prefer to live in the $6,000-$7,000 range to allow more cap room for other positions.
Scholar’s Fun Facts: DFS Quarterback Cash Game Results
- Over 5.00 PV Scoring: 14 (14%)
- Over 3.00 PV Scoring: 60 (or 60%)
- Less than 1.00 PV Scoring: 5 (5%)
- Over 30 points scored: 20 (20%)
- Over 20 points scored: 61 (60%)
- Under 10 points scored: 8 (8%)
Feel free to DM me on Twitter, @GridironSchol91, with any questions and comments.