Draft Strategies | Depth Charts | Mock Drafts | SOS | Tools | ADP
Diehards Staff Experts Poll | Draft Simulator | University Videos
QB Metrics: What They Tell Us About Fantasy Value
The greatest predictor of future performance is past performance.
Narratives, superlatives, expectations, and exclamations surround every group of rookies making the jump from the collegiate ranks to the pros. Every year a "generational" talent is touted as something special that will change the NFL landscape for the next decade-plus. Often these projections fail to pan out, leaving the community collectively dumbfounded as to how talented players fail to live up to the standards that were set for them. This article strips away the reporting choosing to instead focus on what cannot be hidden, the numbers. This model has been refined over the last half decade to reflect what statistics best forecast success and failure for quarterbacks making the transition.
The Model
Harkening back to Bill Parcel's quarterback standards, my model focuses on a number of easily identifiable traits that point to the constant and crucial aspects of quarterbacking. The bust detection ability of this model is virtually perfect, while successful quarterbacks nearly always have the same traits in common. Each year the model is tweaked and updated to reflect the changing college landscape. This model has a proven track record, so much so that The Fantasy Sports Writers Association acknowledged the veracity of the model with the national award, "Best Fantasy Research Article of 2018." Enough with the posturing, below are the traits that are being measured in this year's iteration.
| Passes thrown, career | Games Played (Min 15 Attempts) | % Games won | Career completion % | Last year completion % | Adjusted hand size |
| Ball Velocity (MPH) | TD/INT Ratio (Final year) | TD/INT Ratio, career | Y/A career | Y/A (Final Year) | Wonderlic |
The aim of the model is to focus on the traits that comprise the most repeatable portions of quarterbacking, that is accuracy, dependability, problem solving, and speed of processing.
How the Model is Used
The model is divided into three descriptive divisions: Trend Characteristics, Success Standards, and Death Knell Stats. These variables are not specific to their category and as such fit into multiple standards. Death Knell Stats and the Success Standards weigh more heavily into the final ranking, though they tell an incomplete story. After compiling the variables and weighing the holistic picture, a view of each player becomes distilled.
Trend Characteristics
Every variable depicted in the model is positively correlated with success. In general, the higher the scores on the variables, the more likely a quarterback is to succeed, the lower the scores, the more likely they are to fail. As with any model, the more robust the data sample the more likely the picture created is to be true. Thus, passes thrown, games played, and percentage of games won are crucial to providing dependability to any player's resume. Each repetition provides the player another opportunity to show us who he is. Pretenders have hit hot streaks only to retreat to the mean as soon as they entered the league. Below is Mitch Trubisky's resume depicted in the model:
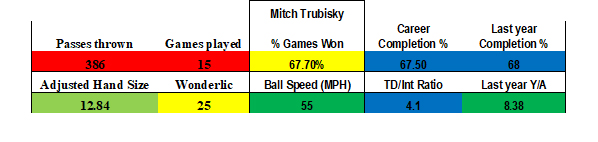
At first glance, Trubisky has the makings of a pro-bowler with a strong arm, big enough hands, and fantastic accuracy to round out the first viewing. It's easy to overlook the fact that he only had a season of production in college where he threw fewer than 26 passes a game. Trubisky is a cautionary tale not to become entranced by someone with one year of production.
Coachability is a Skill
This points to one of the consistent strengths of the model, I have found that when a player has at least two full seasons of production their development as a player is often depicted by their ability to progress as a passer in terms of completion percentage. This trend speaks to their ability to adhere to coaching and grow as problem solvers. If a player fails to develop in college, their ability to develop in the NFL is heavily undercut.
Games Started and Won Combination
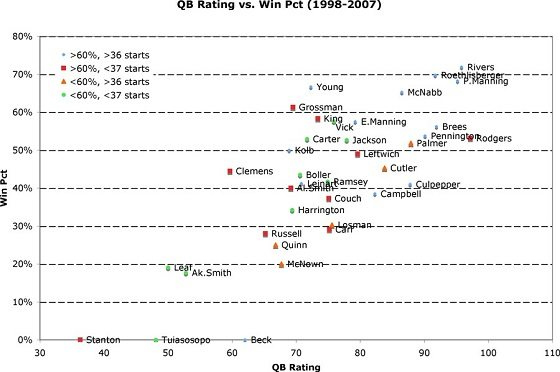
Another prime characteristic that forecasts success in the NFL is reaching a threshold of starting and winning games. If a QB starts more than 32 games and wins more than 70% of them, he frequently succeeds in the NFL. John Paulsen at Scoresreport tracked this trend back in 2010 and the stats have maintained their consistency since then---you can see his correlation below.
As a prospective scout starts compiling the numbers, a clear view of the prospect's capabilities become clear.
Innate Characteristics
No quarterback model would be complete without delving into arm strength and hand size. Both physical characteristics represent trend characteristics as well as Death Knell Stats. This model uses the "Adjusted Hand Score" metric which accounts for height and hand size in one score ((hand size in inches/height in inches) X 100). The quarterback with the lowest hand score in the NFL is currently Jared Goff at 11.84. There have only been two other quarterbacks since the year 2000 who have scored lower and have still been successful: Michael Vick and Tony Romo. Hand size is important because larger hands enable quarterbacks to have better control of the ball under inclement conditions. If a player with small hands goes to a city with heavy snow and/or rain conditions, it will be tougher for them to maintain an elite turnover ratio.
Arm Strength is also important in the model. As of yet, no quarterback has been successful when they threw for under 51 MPH at the scouting combine. Deshaun Watson was shown to have a stronger arm than measured at a number of pro-days and functions as an outlier that was improperly measured. Overall, the stronger the arm, the better chance of success at the NFL level. Many of the S-tier quarterbacks in the NFL have phenomenal arms that allow them to make off-platform throws as well as to fit the ball into windows far smaller than they would have dealt with in college. Without a sufficiently strong arm, quarterbacks fail to deal with the adversity that is inherent to the pros.
Success Standards
Touchdown to Interception Ratio
One characteristic that represented a bright line for success since the year 2000 was a college TD:INT ratio of 3.0. This benchmark demonstrates that a QB is able to be decisive with the ball while consistently avoiding mistakes, both can be signs of speed of processing and good decision making. There are few characteristics more important for a QB in the NFL.
In the 2019 edition of this article, I mentioned that the college football landscape was rapidly changing. With more programs moving towards Air-raid and RPO style offenses, the previous paradigm that put the ball at risk has shifted to a standard where risk minimization along with high-percentage explosive plays are at the core of most top-tier offenses. With these changes, many NFL caliber quarterbacks have started consistently mustering TD:INT ratios far above the 3.0 standard.
Below are many of the top TD/INT ratios before the 2018 draft class.
| Name | TD/INT Ratio |
|---|---|
| Career | |
| Baker Mayfield | 4.37 |
| Cam Newton | 4.29 |
| Andrew Luck | 3.73 |
| Russell Wilson | 3.63 |
| Kyler Murray | 3.57 |
| Aaron Rodgers | 3.3 |
| Carson Wentz | 3.21 |
| Patrick Mahomes | 3.2 |
| Jared Goff | 3.2 |
| Dak Prescott | 3.04 |
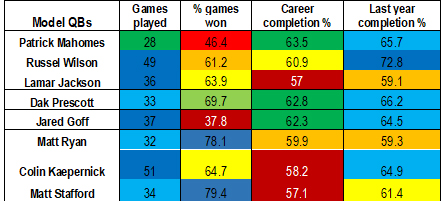
The next figure depicts the TD/INT ratios of many of the top quarterbacks since the 2018 class.
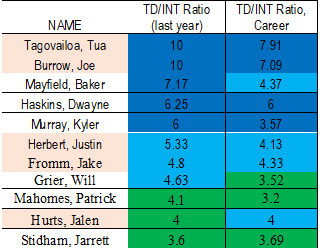
Since the year 2000 the highest TD/INT ratio on record for a quarterback belonged to Russell Wilson at an 8.25, over the last three years we've seen a variety of quarterbacks produce results similar to or exceeding the record. Due to the overabundance of record-breaking performances, the standard requires adjustment. When comparing previous era's performance to current production, a 5 to 1 TD:INT ratio should be the new standard to project expected success.
Death Knell Stats
Last Year Completion Percentage Under 58.5%
Since 2002, there have been zero quarterbacks who have been successful (average QBR of at least 64 or have been conventionally seen as a top-half quarterback) when they completed fewer than 58.5% of their passes in their final year of college. Furthermore, a last year completion percentage under 60% is nearly always associated with failure in the transition from college to the NFL.
Yards per Attempt Deficiency
In the last decade, exceedingly few quarterbacks have been successful when they failed to surpass a final season yards per attempt of 7.4. Quarterbacks like Josh Allen, Gardner Minshew, and Daniel Jones have started stressing this standard, but for now it's a red flag that spells despair for any team drafting a quarterback that wasn't efficient or explosive enough to take advantage of the inferior competition found in the college ranks.
Completion Percentage 16.2 Lower than the Best in the Nation
Reddit super-poster Jaguargator9 known for his data mining and quarterback insights, found that no quarterback in the modern era has been successful when they ended their career with a completion percentage 16.2% under the most accurate quarterback in the nation. This is a prime stat because it scales as the game progresses. Furthermore, the closer one gets to that 16.2% the worse their chances of success become. Having a floor for quarterback performance allows us to parse through the noise to find those that are more hype than substance. This year's top performer was Joe Burrow, with a completion percentage of 76.3, this means that any player who failed to complete more than 60.1 percent of their passes are likely to fail at the next level.
Combine the Standards to Complete the Evaluation
In part two of the article, all of the major rookies will be run through the model to see who has the highest all-pro potential and who's most likely to bust.