AugustUpdate Camp News |
Staff Rankings
| Config Cheat Sheet
| STOMP
Draft Strategies | Depth Charts | Mock Drafts | SOS | Tools | ADP
Diehards Staff Experts Poll | Draft Simulator | University Videos
Draft Strategies | Depth Charts | Mock Drafts | SOS | Tools | ADP
Diehards Staff Experts Poll | Draft Simulator | University Videos
Strength of Schedule (SoS) and Breakout Identifier Part 1 The Numbers
By Adam Hall

Making an Educated Choice
Each year every member of the fantasy community is left with the eternal dilemma, who to pick among the droves of viable options. For the diehard player, each piece of information is integrated and cherished depending on its value. Beyond the occasional camp report or hint from a coach, all the community has to direct these choices is what happened the year prior, along with arrivals, and departures for each team. Thankfully, there is a treasure trove of information to comb through to find nuggets that can lead to success. Through analyzing the most consistent data, along with adjusting production expectations based on off-season changes, one can get a clear picture of who’s most likely to succeed and fail in the coming year. This model follows these principles to find diamonds in the rough as well as sensible investments.
For reference here is a link to last year’s article. After looking over the results, the top suggested teams yielded unknown or under-drafted players like: Alvin Kamara, Kareem Hunt, Christian McCaffery, Alex Collins, Jarvis Landry, Tyreek Hill, Cam Newton, and Carson Wentz just to name a few.
Reviewing the Model
To have a better understanding on why one should trust this model, a basic rundown of its constituent parts is necessary.1. All projections are based on team defensive production.
2. Yards allowed, yards per attempt allowed (rush, pass, and catch), and points allowed by touchdown, are the standards utilized.
3. Once the previous year’s production is characterized, off-season adjustments are added.
4. Free agent changes, retirements, and draft picks account for player movements, while Profootballfocus (PFF) player grade data stands as the objective standard to quantify player production.
5. All changes are quantified and used to adjust the previous year’s production to match expected outcomes for the current year.
6. All adjusted production is summed in a schedule spreadsheet, that gives a single number that depicts expected strength of schedule.
This finalized strength of schedule predicts how difficult the slate of games for each team is and gives the reader a leg up by choosing from teams that have an easier path to follow.
What’s New this Year?
This is the fifth year of development for this model and we’ve added more features this time around.• Project coded in the programming language “R” to increase flexibility and data comparison abilities.
• Charted playoff difficulties
• Addition of supplemental weights for arriving and departing players.
• Addition of weights for players based on position.
These additions help control for the non-linear quantification of PFF’s player data, as it seems that the best players in the league contribute far more production and leadership than an above average player. Furthermore, certain positions contribute substantially more to pass (cornerbacks) or rush (defensive interior) defense than others, and their impact was adjusted accordingly. Finally, to help refine player picks, a series of playoff SoS tables were made. The teams with the toughest and easiest playoff schedules are shown, since there’s no use in drafting a player only for them to run into a brick wall when you need them most.
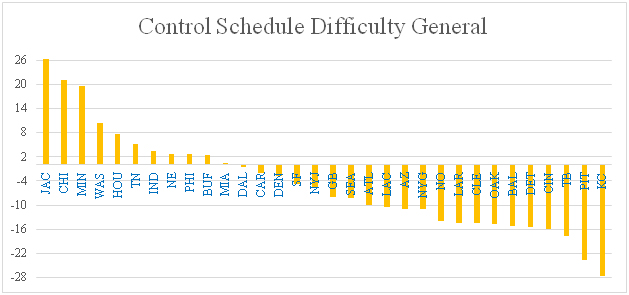
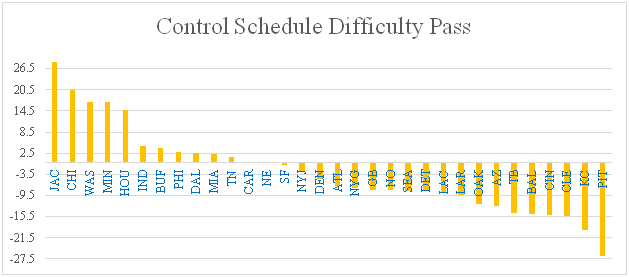
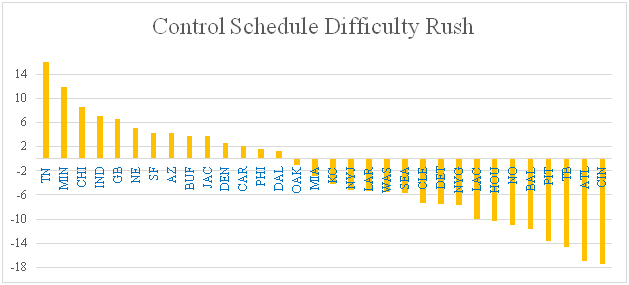
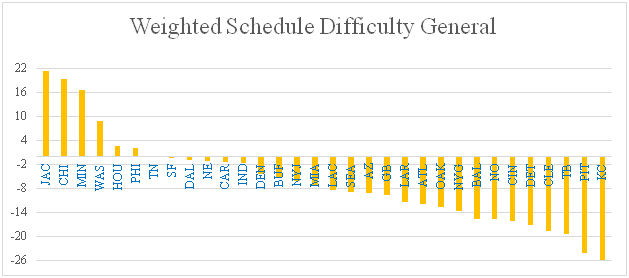
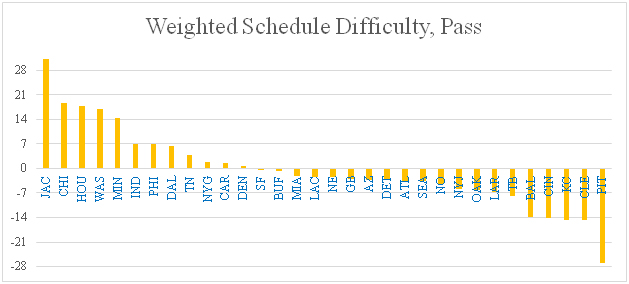
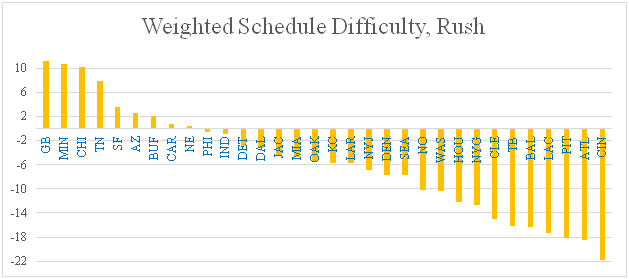
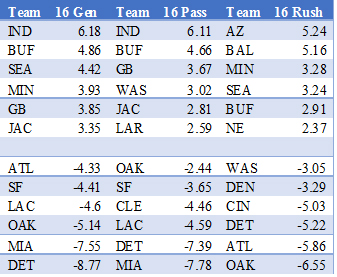
How to Use the Data
The SoS data is arranged in easy to understand graphs. Teams with positive values have easier schedules than those with more negative figures. For example, Jacksonville has an easier schedule on average than Pittsburg. The same standard is used in the playoff tables, with positive values indicating an easier matchup than those with negative numbers.Also, since the free agent and positional weights are new, the previous year’s model was computed with those outcomes shown to provide extra context to the reader. Charts marked as “control” are without the extra weights added in. Both charts are viable, and can be used together to give the user more confidence in the projections.
Note: Just because a team has a small negative value doesn’t mean that they should be treated as a draft pariah. It is extremely common for numerous breakout players to come from teams ranked in the top-ten of the model (Kansas City was ranked fifth in rush and pass, while New Orleans was ranked 7th in rush last year).
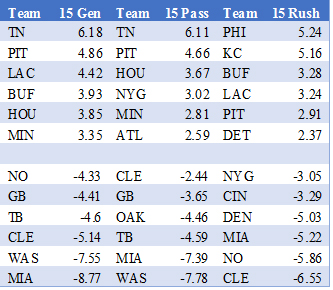
Playoff Strength of Schedule.
*Direct scores were given in lieu of opposing teams to help prevent bias. Once again, easy matchups are depicted by positive scores, and difficulty matchups are shown via negative scores.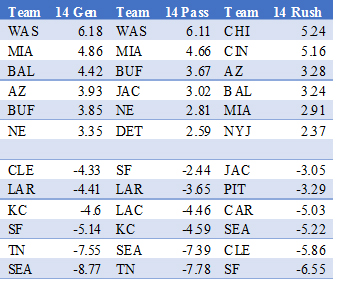
Happy Drafting
When used as a supplement along with other draft preparation this model stands to give any player a leg up on the competition. The next article will focus on those players who stand to gain the most from their superior opportunities.