AugustUpdate Camp News |
Staff Rankings
| Config Cheat Sheet
| STOMP
Draft Strategies | Depth Charts | Mock Drafts | SOS | Tools | ADP
Diehards Staff Experts Poll | Draft Simulator | University Videos
Draft Strategies | Depth Charts | Mock Drafts | SOS | Tools | ADP
Diehards Staff Experts Poll | Draft Simulator | University Videos
What The Numbers Say About Success And Failure For Quarterbacks Pt 3 Success
By Adam Hall

Signs that point to wins
For every standard that points to failure, there’s a counterpoint that projects success. This article focuses on the standards that are correlated with pro-bowls and all-pro awards. There is no full proof method for predicting a hall of fame caliber quarterback, but over the years trends appear that can point any interested agent in the right direction.
The following guidelines have been found to be associated with successful quarterbacks:
• Each of the categories in this model are positively correlated with success, the higher the scores, the better the outcome on average.
• Starting at least 32 games in college and winning at least 70% of them.
• A college passing TD to INT ratio of 3:1
• A Hand Score of 13 or above ((Hand Size” / Height”) X 100)
• Having both a career and last year completion percentage of 65 or higher.
Overview
Trend Characteristics
The first bullet point doesn’t need a lot of elaboration, if you see something that’s conventionally seen as a positive characteristic and a person has it in droves, it’s a great sign. Each of the variables listed below are positively associated with success, even the much maligned Wonderlic test. Clay Travis at outkickthecoverage found that the average Wonderlic score of Superbowl winning quarterbacks was 30.7 which would have classified as “far above average” in the model.Every marker of on field performance from completion percentage, to TD/INT ratio, to Y/A (yards per attempt passing), to wins, and games started show a certain aspect of quarterback performance. A successful analyst looks at the entire picture instead of cherry picking a favorite metric when attempting to find a successful player.
Starting and Winning Combination
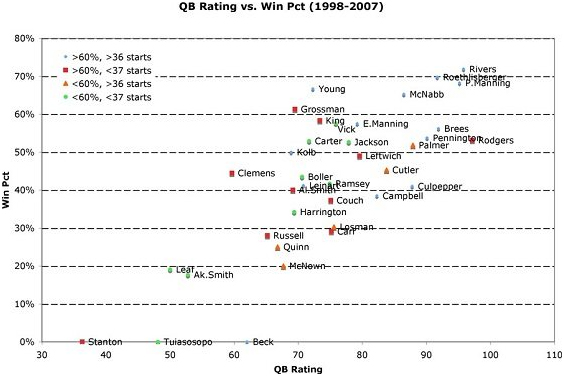
Due to the inherent complexity of the quarterback position, experience and success are intrinsically tied together. Quarterback, more so than any other position requires an intricate understanding of the game, and there is no other teacher as influential as experience. According to my model there’s a 7:1 ratio of successful quarterbacks (QBR 64 or above, along with a playoff appearance) who won more than 60% of their games in college, compared to those who didn’t. This means that if a quarterback fails to propel their team to the winner’s circle in college, that they’ll be unlikely to do so in the future. Of course, there are the likes of Jimmy Garapollo, Jared Goff, and Jay Cutler out there that have immense enough physical and mental gifts that they can overcome this poor resume; but for every one of them there are three Kyle Bollers or Jake Lockers.John Paulsen at Scoresreport tracked the combination of quarterback starts and wins back in 2010, the stats have maintained their consistency since then---you can see his correlation below.
3:1 Touchdown to Interception ratio
After combing through the data, one substantial new trend popped out, that although there is no floor that dooms QBs to the unemployment line (Tom Brady had a TD/INT ratio under 2), a TD/INT ratio of 3 or above is highly associated with QB success. A majority of starting QBs in the NFL had a career TD/INT ratio of 3:1 or higher, while a vast majority of starting QBs (90+%) had at least a 2:1 TD/INT ratio. While time has progressed, this seems to be more-strict as well, all the players who had lower marks than 2:1 were drafted in the 2000s (Brady, Ryan, Stafford, Brees (2.0). It’s plain to see that with modern offenses it’s expected that QBs make quick and correct decisions, if a QB has a poor track record of turnovers in college, the trends won’t stop in the NFL. It should be no surprise if the days of seeing successful quarterbacks with a sub 2:1 TD/INT ratio coming out of college are far behind us.
Hand Score: 13 or above.
In 2014, Jonathan Bales at Rotoworld found that not only is hand size extremely important to quarterback success, but that if you adjust the data point to include the height of a quarterback, hand size becomes an even more important predictor of success.This model pointed out that Dak Prescott, Russell Wilson, and Drew Brees would be extremely successful quarterbacks. The higher the score, the smaller the body to hand ratio is. This leads to fewer turnovers as there is less space for defenders to strip the ball away from QBs. If a QB can cradle the ball into their chest, it’s much more difficult for him to fumble. This standard seems to carry over to using the entire body as a unit when throwing the ball as well. Throwing an NFL football accurately requires not just arm strength, but leg and trunk cohesion as well. The entire body needs to function as a unit and when you have a smaller QB with larger hands, that increases the ease of entire body control, simply because there’s less that a QB must control kinesthetically.
From the data dive, I’ve found that the rate of hits increase after the hand score reaches 13. There are a number of great players that don’t reach these heights, but it’s a great sign for a prospect when they do.
College Career and Last Year completion percentage above 65%
Perhaps the most obvious of the metrics is a high completion percentage. Quarterback completion percentage tends to dip upon entry to the league and then usually returns to the original baseline demonstrated in college.With that in mind, you want as much cushion as possible with your college quarterback. With a high-level baseline, it’s likely that the QB will immediately complete more passes and have fewer issues acclimating to the more difficult population in the NFL. The habits developed in college don’t magically disappear just because a player was drafted. Good habits lead to high completion percentages, and players that don’t have to do as much work to reach a sufficient level of competency can focus on learning the craft of a pro-style offense. This extra time can aid a player in dealing with the slings and arrows of the NFL. Players like Christian Hackenberg and Jake Locker had to overcome far more just to be average compared to players like Andrew Luck and Deshaun Watson.
Finally, a career completion percentage in the 50s doesn’t doom a player if they have steadily increased their completion percentage every year of their career. This is the standard that an analyst loves to see, because it shows that the player is coachable, and they actively introduce their lessons into their play. If a player like Hackenberg has a great freshman year, and fails to ever get better, or worst yet sees a decline in their production, it’s a very bad sign for future NFL success.
Model QBs

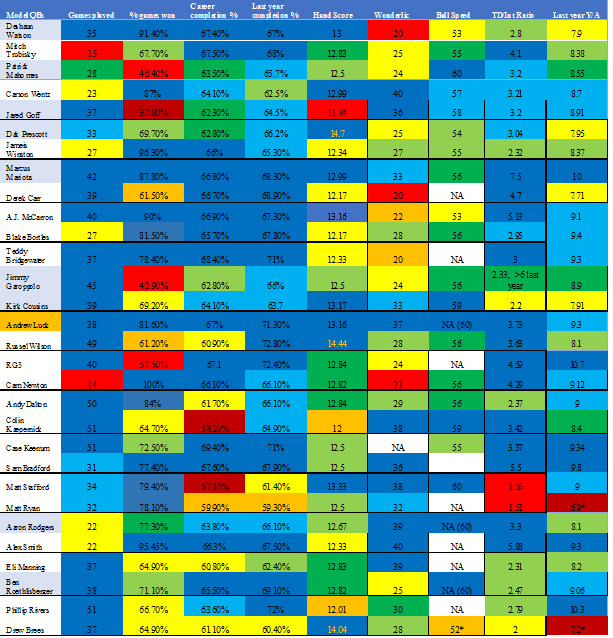
*both Matt Ryan and Drew Brees came out of a time in college where offenses were less explosive and lower Y/A scores were more commonplace.
As you can see: Andrew Luck, Aaron Rodgers, Russell Wilson, Deshaun Watson, Carson Wentz, and others had exceptional scores. This overall mosaic of success allowed them to more easily transition to the NFL and have success.
Even beyond the day-one starters. Players like: Derek Carr, Dak Prescott, Case Keenum, Andy Dalton, and Jimmy Garappolo were identified as franchise caliber QBs. The cream eventually rises, and these players in particular are ready for success.
If given more opportunities players like: AJ Mccarron, Bryce Petty, and Geno Smith could be great players.
This dataset deliberately left out rookies, as this will be the focus on the fourth and final article in the series, predicting the success and failure of the 2018 rookie class.